
Domestic migration 2025 witnesses a bit of a domestic migration slump. The move rates dropped, and more people chose to relocate to areas closer to home rather than cross state lines. What are the exact numbers, you ask?
Well, the Census Bureau’s annual state-to-state migration flow isn’t out yet. However, there are still reliable databases out there.
For this article, we went with HireAHelper’s Moving Migration Report, which is based on the PGM’s dataset of real-time relocation activity. We also relied on the National Movers Study by United Van Lines, which analyzed shipment data throughout the year.
Read on for insights into the most moved-to states, most moved-from states, mover demographics, and the main reasons for relocation in 2025.
Key Takeaways
- Nearly 15 million adults (over 4% of the population) moved within the US in 2025.
- Same-state moves remain dominant, accounting for over 78% of all moves.
- August was the most active month for moves.
- South Carolina had the highest net migration gain per capita, with 79.7 adults added to the population per 10,000 residents.
- Massachusetts has the highest net migration loss per capita, losing 37.9 residents per 10,000.
- 93,492 more people moved out of California than into it.
- Gen X made the most moves, followed by millennials.
- The number one reason for relocating was to live closer to family, at a 29.13% share.
- Florida was the number one inbound state for retirees.
How Many People Moved in 2025
HireAHelper’s study is based on a database of 14,977,223 adults who moved within the US. Assuming that this is the total number of movers for the year, 4.46% of the population relocated in 2025.
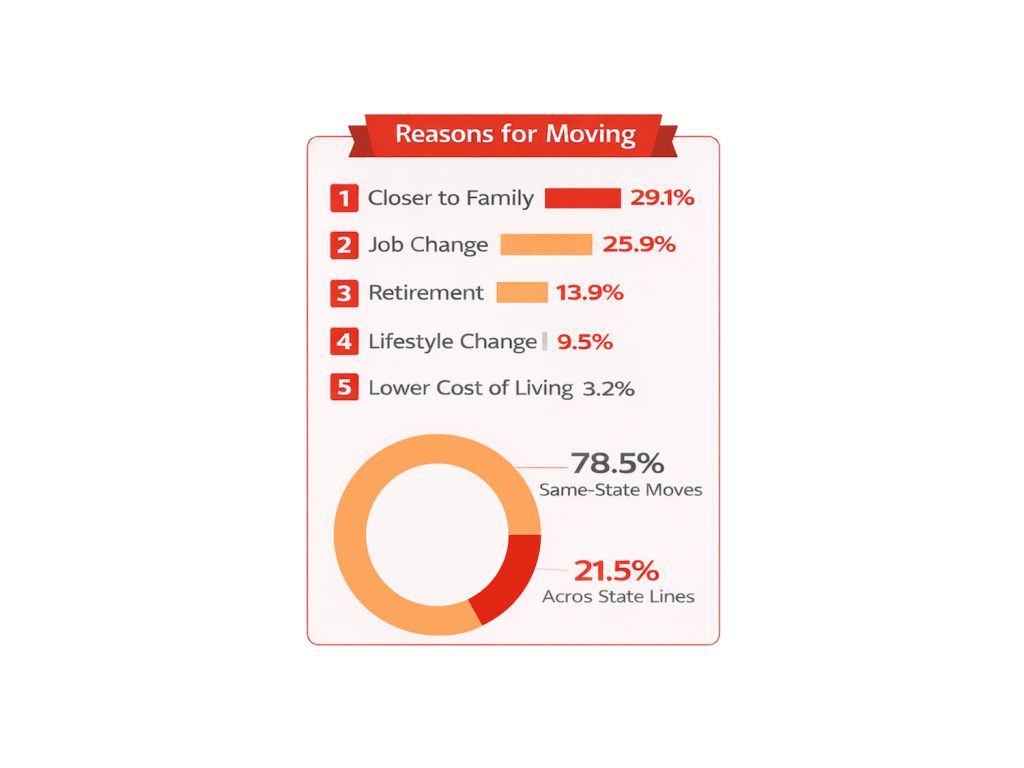
Percentage of Same-State Moves
Out of the nearly 15 million recorded moves, over 11.7 million were within state borders. This puts the same-state moves of 2025 at around 78.5%.
Percentage of Moves Across State Lines
In 2025, a bit over 3.2 million moves were made across state lines. This means that 21.5% of recorded moves were interstate moves.
Percentage of the Population That Moved to a Different State
Less than 1% of the population moved across state lines in 2025.
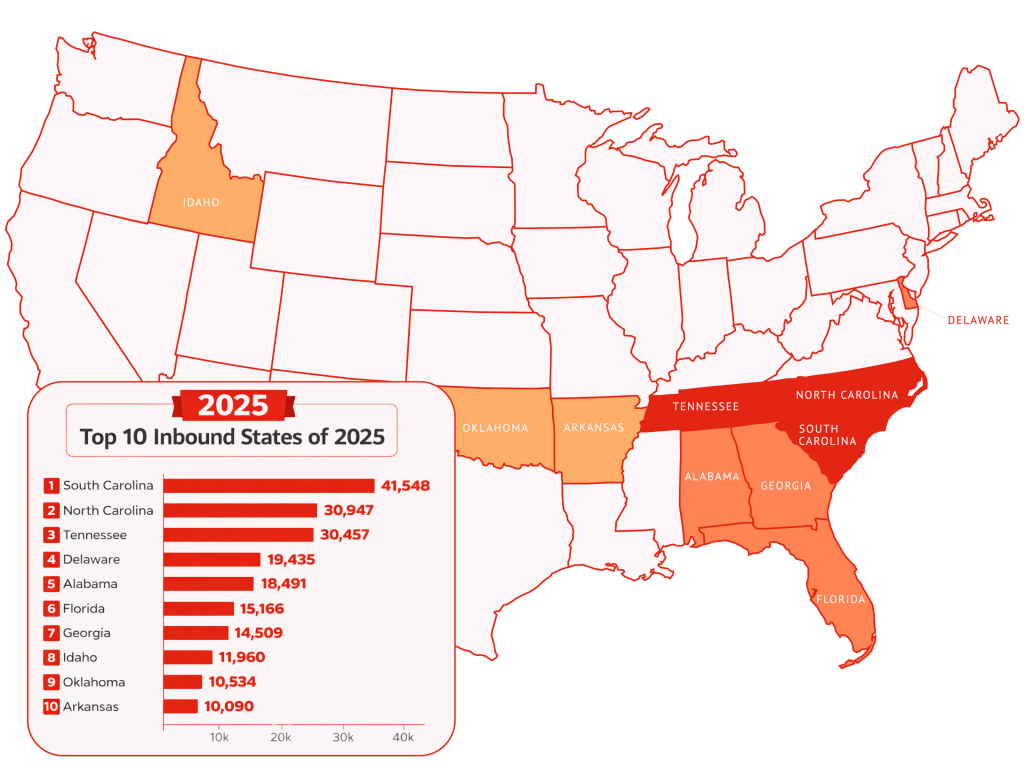
The Top 10 Inbound States of 2025
Besides the data from HireAHelper and United Van Lines, we referenced state affordability and opportunity rankings from US News & World Report.
1. South Carolina
- #22 in affordability
- #42 in opportunity
According to HireAHelper’s migration report, South Carolina had the highest net migration per capita in 2025, with 79.7 adults gained per 10,000 people.
However, even if we don’t consider the per capita stats, South Carolina is still up there, with a total of 41,548 more people moving into the state than out of it.
Plus, United Van Lines annual study reports that 60.8% of the state’s shipments were inbound.
2. North Carolina
- #24 in affordability
- #18 in opportunity
North Carolina witnessed a net population change of 30,947 adults. That’s 29.2 adults gained per 10,000 people.
United Van Lines reported 57.8% inbound shipments to the state.
3. Tennessee
- #19 in affordability
- #22 in opportunity
Tennessee came pretty close behind North Carolina in the HireAHelper report, with a gain of 30,457 adults and 56% inbound shipments.
The per capita gain, however, was an impressive 43.6 adults per 10,000.
4. Delaware
- #33 in affordability
- #15 in opportunity
United Van Lines recorded 59.6% inbound shipments to the state, which puts it in the number four spot in the study.
In HireAHelper’s report, Delaware came third in the per capita trends, with a rate gain of 54.5 per 10,000 residents.
5. Alabama
- #8 in affordability
- #26 in opportunity
Alabama came fifth in HireAHelper’s report, with a total net population change of 18,491 and 36.6 adults gained per 10,000 residents.
In the United Van Lines study, however, the ninth spot was reserved for Alabama, with 57.1% total inbound shipments.
6. Florida
- #44 in affordability
- #47 in opportunity
Florida gained a total of 15,166 adults in 2025 due to migration. That makes it the sixth most inbound state in HireAHelper’s report.
However, the number isn’t all that impressive when adjusted for the already-large population—it’s a gain of 6.9 per 10,000.
7. Georgia
- #27 in affordability
- #32 in opportunity
Domestic migration boosted Georgia’s population by 14,509 adults (13.4 per 10,000 residents).
8. Idaho
- #21 in affordability
- #10 in opportunity
HireAHelper recorded a net population gain of 11,960 in Idaho, with an impressive per capita gain. Migration added 63.2 residents per 10,000 to the state in 2025.
As for United Van Lines’ counts, the study tracked 57.8% inbound shipments to Idaho.
9. Oklahoma
- #5 in affordability
- #30 in opportunity
The state’s population grew by 10,534 (26.4 adults per 10,000) due to domestic migration, with 17.1% of movers relocating to Oklahoma for the improved cost of living.
10. Arkansas
- #1 in affordability
- #28 in opportunity
Arkansas saw a total net population change of 10,090 adults, which is about 33.3 adults gained per 10,000 residents.
The inbound shipments were 57.2% of the total recorded state shipments.
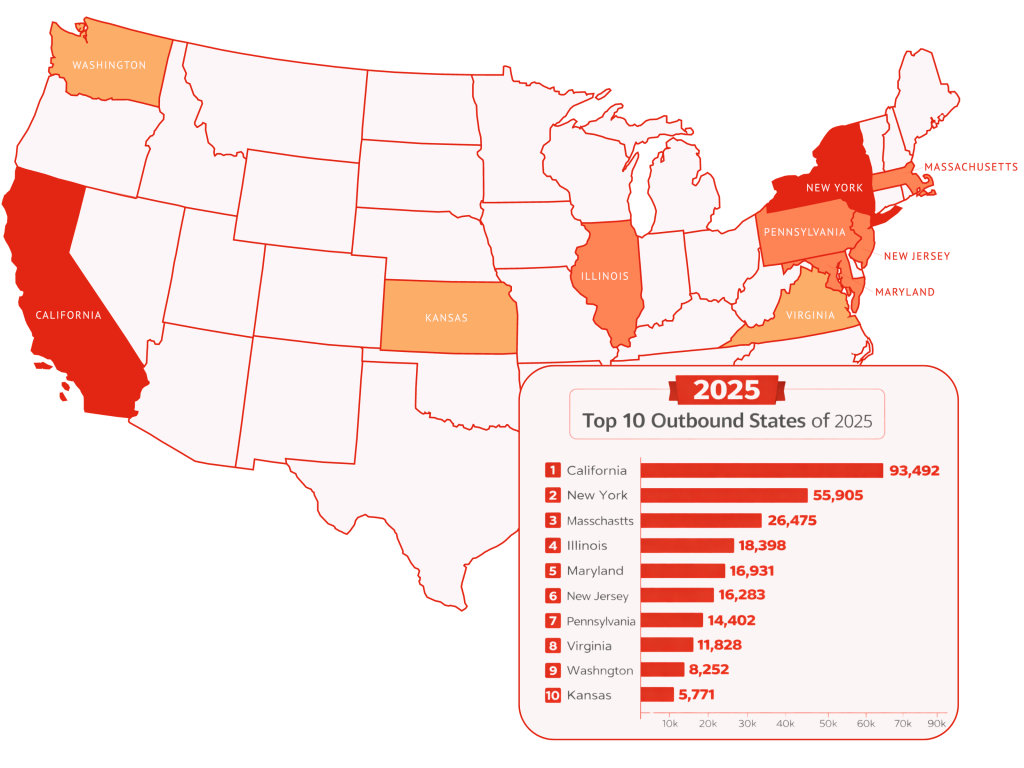
The Top 10 Outbound States of 2025
Next, we’ll take a look at the most moved-from states for the year.
1. California
- #50 in affordability
- #50 in opportunity
The highest net migration loss in 2025 was in the Golden State. According to HireAHelper, 93,492 more people moved out of the state than to it. That’s a loss of 25.1 adults per 10,000 residents.
United Van Lines also recorded 57.8% outbound shipments from the state.
2. New York
- #45 in affordability
- #49 in opportunity
When it comes to net migration loss, New York is a distant second to California, with a net migration loss of 55,905.
Yet, there isn’t that much of a gap when we consider the per capita insights. In fact, New York would come ahead of California, since it lost 28.2 residents per 10,000.
New York, too, had around 57.8% outbound shipments.
3. Massachusetts
- #47 in affordability
- #41 in opportunity
Massachusetts saw a net migration loss of 26,475, which is 37.9 adults lost per 10,000.
United reported that 54.7% of the total state’s shipments were outbound.
4. Illinois
- #32 in affordability
- #35 in opportunity
Illinois took the fourth spot on HireAHelper’s migration report, with 18,398 more people moving out of the state than into it. That’s a loss of 14.5 per 10,000 residents.
5. Maryland
- #41 in affordability
- #27 in opportunity
The net migration loss in Maryland was 16,931. In terms of per capita estimates, that’s 27.4 adults lost per 10,000.
6. New Jersey
- #49 in affordability
- #45 in opportunity
Close behind Maryland is New Jersey, with its net migration loss of 16,283. The per capita loss, however, is vastly different, with New Jersey losing 17.6 per 10,000.
United Van Lines estimates that 62.33% of the state’s recorded shipments were outbound.
7. Pennsylvania
- #28 in affordability
- #29 in opportunity
14,402 more people moved out of than to Pennsylvania. This translates to 11.1 adults lost per 10,000 residents.
8. Virginia
- #37 in affordability
- #25 in opportunity
Virginia witnessed a net migration loss of 11,828, or 13.7 adults lost per 10,000 residents.
Interestingly, United Van Lines doesn’t even consider Virginia an outbound state. Based on the 2025 movers study, 51.78% of the state’s shipments were inbound, which would make a mostly “balanced” state.
9. Washington
- #46 in affordability
- #40 in opportunity
Washington lost a net of 8,252 people to domestic migration in 2025. This is about 10.7 adults lost per 10,000 residents.
10. Kansas
- #11 in affordability
- #5 in opportunity
The state lost a net of 5,771 adults or 19.6 adults per 10,000.
Much like Virginia, Kansas’ stats are split between the two studies. United Van Lines considers the state balances, with a very negligible difference between inbound and outbound shipments.
Migration Stats: HireAHelper vs. United Van Lines
HireAHelper and United Van Lines studies used different datasets. So, it’s only normal that the findings vary from one study to another.
Here are some points to keep in mind:
Texas Is the Main Divisive Point
According to HireAHelper’s study, Texas had a net gain of 68,318 adults in 2025. This makes it the number one state in terms of net migration gain if we ignore the per capita insights.
And if we do use the per capita insights, HireAHelper reports that the Lone Star State gained 23 adults per 10,000 existing residents. Either way, it’s still one of the top inbound states for the year.
However, that’s not what United Van Lines’s data tells us at all.
United tracked a total of 16,766 shipments to and from Texas. 8,500 (50.7%) were inbound, while 8,266 (49.30%) were outbound. So, the company actually considers Texas a balanced state.
But Texas isn’t the only point of contention.
There are a few states that made it to the top 10 lists from HireAHelper, while still being considered more or less balanced by United Van Lines.
Here’s how the numbers vary among the two studies:
| State | Gain/loss, according to HireAHelper | HireAHelper’s Ranking | Shipment percentage, according to United Van Lines |
| Texas | +68,318 | 1st inbound | 50.7% inbound |
| Florida | +15,166 | 6th inbound | 52.19% inbound |
| Georgia | +14,509 | 7th inbound | 51.7% inbound |
| Illinois | -18,398 | 4th outbound | 54.34% outbound |
| Maryland | -16,931 | 5th outbound | 52.37% outbound |
| Pennsylvania | -14,402 | 7th outbound | 51% outbound |
| Virginia | -11,828 | 8th outbound | 51.8% inbound |
| Washington | -8,252 | 9th outbound | 52.36% outbound |
| Kansas | -5,771 | 10th outbound | 50.1% inbound |
It’s worth noting that Illinois isn’t a historically balanced state in the United Van Lines annual movers study. In fact, it has been more than a decade since Illinois was last considered balanced.
New Jersey and Cali Go Head to Head
The number one slot on the outbound list can go to either California or New Jersey, depending on the study you choose to follow.
HireAHelper’s study shows that California has the highest net migration loss in 2025, with 25.1 adults lost per capita. New Jersey, however, lost 17.6 adults per 10,000 residents.
Meanwhile, United Van Lines reports that New Jersey had 62.3% outbound shipments. This would easily put it ahead of California, which reportedly had 57.8% outbound.
That being said, United recognizes that New Jersey was a common migration destination for younger families and movers between 18 and 34 years, so much so that the study dubs it a “launch state.”
That’s why we choose to go by HireAHelper’s estimates and keep Cali in the number one spot.
Different Metros Leading the Migration Trend Board
Based on HireAHelper’s data, the Myrtle Beach–Conway–North Myrtle Beach metropolitan statistical area in South Carolina tops the list, with 190 new residents per 10,000 existing residents.
United Van Lines, on the other hand, ranked Eugene-Springfield, Oregon, as the most inbound metro. Myrtle Beach did make the United annual study, but it ranked a bit lower, at the fifth spot.
There’s Decent Overlap
Don’t let the differences we just went over make you think that the studies are vastly different. There’s still an overlap in outbound and inbound rankings.
For instance, both studies ranked New York as the second most outbound state. Plus, the following states were considered highly outbound in both reports:
- California
- New Jersey
- Massachusetts
As for the inbound leaders, the overlap includes all the following states:
- South Carolina
- North Carolina
- Alabama
- Idaho
- Arkansas
- Delaware
2025 Migration Trends by State (Per Capita)
Ranking strictly by total net population change can skew the data towards the large states, as we’ve discussed in the case of Texas.
Here are the top five lists, according to HireAHelper’s per capita measures:
Top Inbound States: Residents Gained Per 10,000
- South Carolina: 79.7
- Idaho: 63.2
- Delaware: 54.5
- Tennessee: 43.6
- Alabama: 36.6
Top Outbound States: Residents Lost Per 10,000
- Massachusetts: 37.9
- New York: 28.2
- Maryland: 27.4
- California: 25.1
- Kansas: 19.6
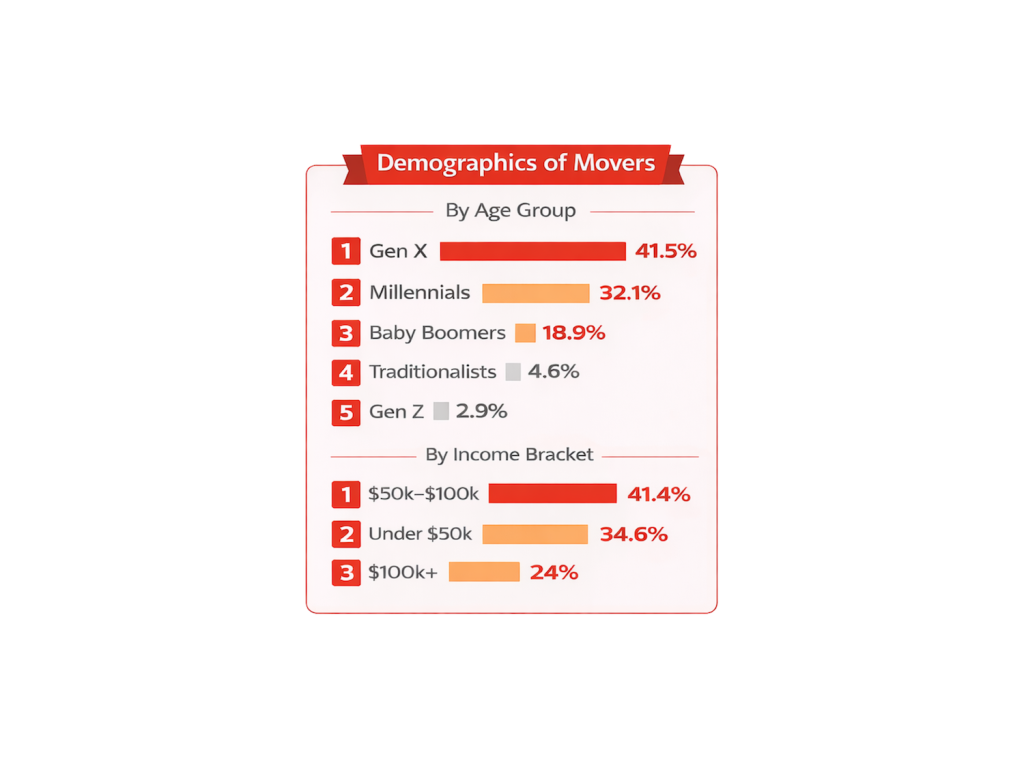
Demographics of Movers
HireAHelper’s report offered some helpful insights on the migration demographics. Let’s take a closer look:
By Generation
Gen X led the domestic moves in 2025 with a share of 41.5%. Millennials and baby boomers came next, at 32.1% and 18.9%, respectively.
In the far distance, traditionalists were responsible for 4.6% of the moves. Gen Z relocated the least of all generations, with a share of merely 2.9%.
Note that when you adjust for the population size of each generation, Gen X’s impact becomes even more massive (69%), while Gen Z’s impact gets more minuscule (-75%).
By Income Bracket
Households earning $50K–$100K moved at a significantly higher rate than other households.
And if we look at how the income brackets relate to moving destinations, we’ll find that higher-income movers choose Connecticut, New Jersey, and Maryland. Meanwhile, low-income movers favored West Virginia, North Dakota, and Mississippi.
For instance, 36.3% of Connecticut’s movers earn $100K–$200K, while 42.1% of West Virginia movers earn $50K–$100K.
Reasons for Moving
According to United Van Lines, the dominant reason for moving in 2025 was to get closer to family, at 29.13%. Very close behind it was relocating for work, with a share of 25.92%.
Retirees took a 13.86% share, while lifestyle changes motivated 9.54% of the moves. As for the cost of living, it was the driving force behind only 3.22% of the moves.
Here’s the leading state for each relocating reason, with the percentage of inbound moves:
- Closer to family: North Dakota, 50%
- New job or company transfer: Washington, D.C., 52.4%
- Retirement: Florida, 29.8%
- Lifestyle change: Maine, 16.2%
- Improved cost of living: Oklahoma, 17.1%
Monthly Migration Trends in 2025
Migration rates spiked in August, which makes sense when you consider that families tend to move before the beginning of the school year.
For instance, 15.1% of the population change in South Carolina was made in August, compared to 3.3% in November and 7.4% in January.
Domestic Migration Stats: 2024 vs. 2025
By comparing the 2025 insights to 2024 data (from HireAHelper’s report and official Census reports), we can see that:
- 2025 witnessed a slowdown, with around 10 million fewer recorded moves (25.87 million in 2024 vs. 14.97 million in 2025).
- A smaller portion of the population (less than 1%) made cross-state moves in 2025, compared to 2024 (2.1%).
- Vermont dropped from having the biggest net gain in 2024 to losing 1.7 adults per 10,000 residents in 2025.
- New Hampshire held the biggest net loss in 2024 but turned into an inbound state and gained 18.8 adults per 10,000 residents in 2025.
- Myrtle Beach–Conway–North Myrtle Beach replaced Los Angeles-Long Beach-Anaheim as the top metro.
- Relocating to live closer to family remained the main reason for moving (28.33% in 2024 and 29.13% in 2025).
Looking for a Moving Company?
If you’re moving in 2026 and want a hassle-free experience, Word of Mouth Moving is here to help. Whether it’s a local move or a long-distance relocation, our experienced team makes every move smooth, safe, and efficient. Check out Word of Mouth Moving to learn how we can help you get to your new home stress-free.


